Quick Start: Enter Your Own Figures
Try the Free Demo, Then Type Your Own Figures
Last verified against the app:
Type Your Figures In
This is the typed-figures start of the 2diff Business Quick Start. You type in your headline figures (revenue, expenses, assets, liabilities) and 2diff Business gives you full financial statements, 23 ratios, trends, and a forecast. No accounting software, no import, no setup.
Bronze and Silver both work from typed figures. Bronze is the calculator on its own, with no AI. Silver adds AI Insights. Compare the plans on the Plans and Pricing page.
Step 1: Open the live demo
Open the Bronze demo. It loads instantly, no sign-in required.
If you have no accounting software, or you just want to see how 2diff Business works before typing in your own numbers, you can go from this page straight to a running app. The demo is preloaded with realistic sample figures and opens on the Dashboard with the analysis already done, so every screen has something to look at.
Step 2: Change a number and watch everything update
The input side of 2diff Business is Enter Data, in the Accounting Data group in the sidebar. In the demo it comes pre-filled with the sample company. Pick a year with its button, then type your headline figures under Totals (Profit & Loss, Balance Sheet, and Cash Flow); switch to Accounts if you want line-item detail. Calculated lines such as Gross Profit and Net Income show their live total in bold inside the box and update as you type.
Change any input, then select Update analysis at the top of the page. The statements, ratios, trends, forecast, and dashboard all update.
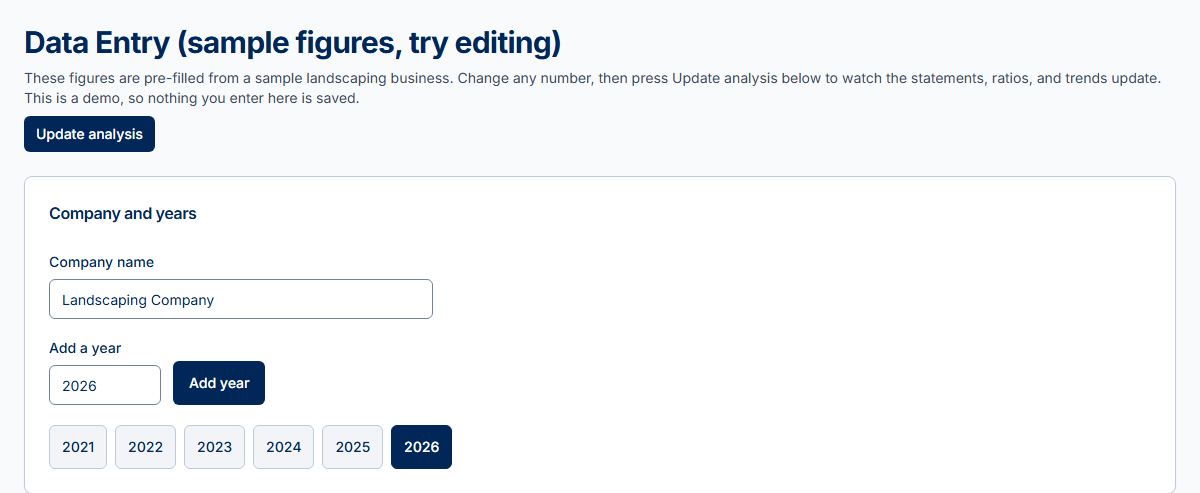
You type in a few headline numbers and watch the health of the business come out the other side. No spreadsheet, no software install.
Step 3: Read the analysis surfaces
Every analysis surface works on typed figures:
- Dashboard: the at-a-glance summary
- Financial Statements: Profit & Loss, Balance Sheet, and Cash Flow (Cash Flow is derived from the two Balance Sheets), plus Combined for all three side by side. Set a statement's Mode to Common Size to see it as percentages
- Trends: year-over-year changes
- Ratios: the 23 tracked ratios
- Forecast: level, growth, goal-based, or driver-based projection
- Goal Center: track goals against actuals
- Valuation: six ways to estimate what the business is worth
It is the same analysis engine 2diff Business runs on connected books, fed by the annual figures you enter yourself. The demo and the Bronze plan run without AI, by design.
Step 4: Subscribe and enter your own figures
The demo resets when you leave it, so nothing you type there is saved. To work on your own numbers:
- Pick Bronze or Silver on the Plans and Pricing page, or pick 2diff Business on the Apps page.
- Create your account and verify your email if you have not already, then complete payment through our secure Stripe checkout.
- You land back on your App Dashboard. Open the 2diff Business card.
- 2diff Business opens on your data entry screen, the same entry surface the demo uses. Type a year in the Add a year box, select Add year, and enter your own headline figures. If you have not added a year yet, Load sample figures fills in a fictional example you can edit instead.
- Your figures save to the cloud as you go (the badge next to Company and years reads Saved), so they are there on your next visit and on your other devices. There is no save button.
- Running more than one business? Use the business picker at the top of the sidebar: Add a business adds one, up to six, and with two or more, All businesses (combined) adds them together, read only.
If a year is only partly complete, fill in Figures through for it so the dashboard, ratios, and forecast treat it as a part year instead of a full one.
Add a second year when you want trends and a forecast. Everything you walked through in Steps 2 and 3 works the same way on your own numbers.
Want AI Insights or connected books? 2diff Business Silver adds AI Insights and can connect your accounting software instead of typing. On Silver you can still type your figures: in Settings, set Data Source to Manual entry.
Related
- Live 2diff Business demo: no login, edit-in-place
- Enter Your Own Figures: the full typed-figures chapter of the guide
- 2diff Business Quick Start: both ways to start
- 2diff Business Guide: every feature, every screen