Enter Your Own Figures
A Chapter of the 2diff Business Guide
Last verified against the app:
2diff Business Guide > Enter Your Own Figures
Introduction
2diff Business turns a handful of annual figures you already have into full financial statements, 23 ratios, trends, a forecast, Goal Center, and valuation. You type in your numbers. There is nothing to connect and no accounting software required.
This chapter of the 2diff Business Guide covers typing your figures in: what to gather, how entry works, the Balance Check, part-year figures, and how each screen reads the figures you typed. The rest of the guide covers every screen in full.
What You Need
2diff Business works from the headline numbers most owners already have. Before you start, gather your annual figures for the years you want to analyze:
- Profit and loss: total income (revenue), cost of goods sold, operating expenses, and a few smaller lines.
- Balance sheet: cash, receivables, inventory, fixed assets, payables, credit cards, loans, and equity.
You do not need every line item. Enter what you have. 2diff Business calculates the totals, the full cash flow statement, and the ratios for you.
Getting Started
Getting into 2diff Business
There are two ways in, and you can take them in either order:
- Try it first. Open the live 2diff Business demo. It is preloaded with sample figures, needs no login, and lets you edit the numbers to see how the statements, ratios, trends, and forecast respond. Nothing you type in the demo is saved.
- Subscribe and use your own figures. Pick Bronze or Silver on the Plans and Pricing page, create your account, verify your email, and complete payment through Stripe. 2diff Business then appears on your App Dashboard and your figures save to the cloud.
Already on Silver? You can type your figures too. In Settings, set Data Source to Manual entry and you work on the same Enter Data screen this chapter describes.
Opening the Analyzer
As a subscriber you open 2diff Business from your App Dashboard. The app opens on your data entry screen, headed Your Financial Data, because there is nothing to connect. From there, every analysis screen is one click away in the sidebar, and Enter Data (in the Accounting Data group of the sidebar) always brings you back to your figures.
The demo works the other way round. It opens on the Dashboard with the sample figures already analyzed, so you see the result first. Open Enter Data to see and change the sample figures, then select Update analysis to send your changes through every screen.
Entering Your Figures
Enter Data is where the work happens. You work on one year at a time: pick the year, type its figures, and the calculated lines fill in for you as you go.
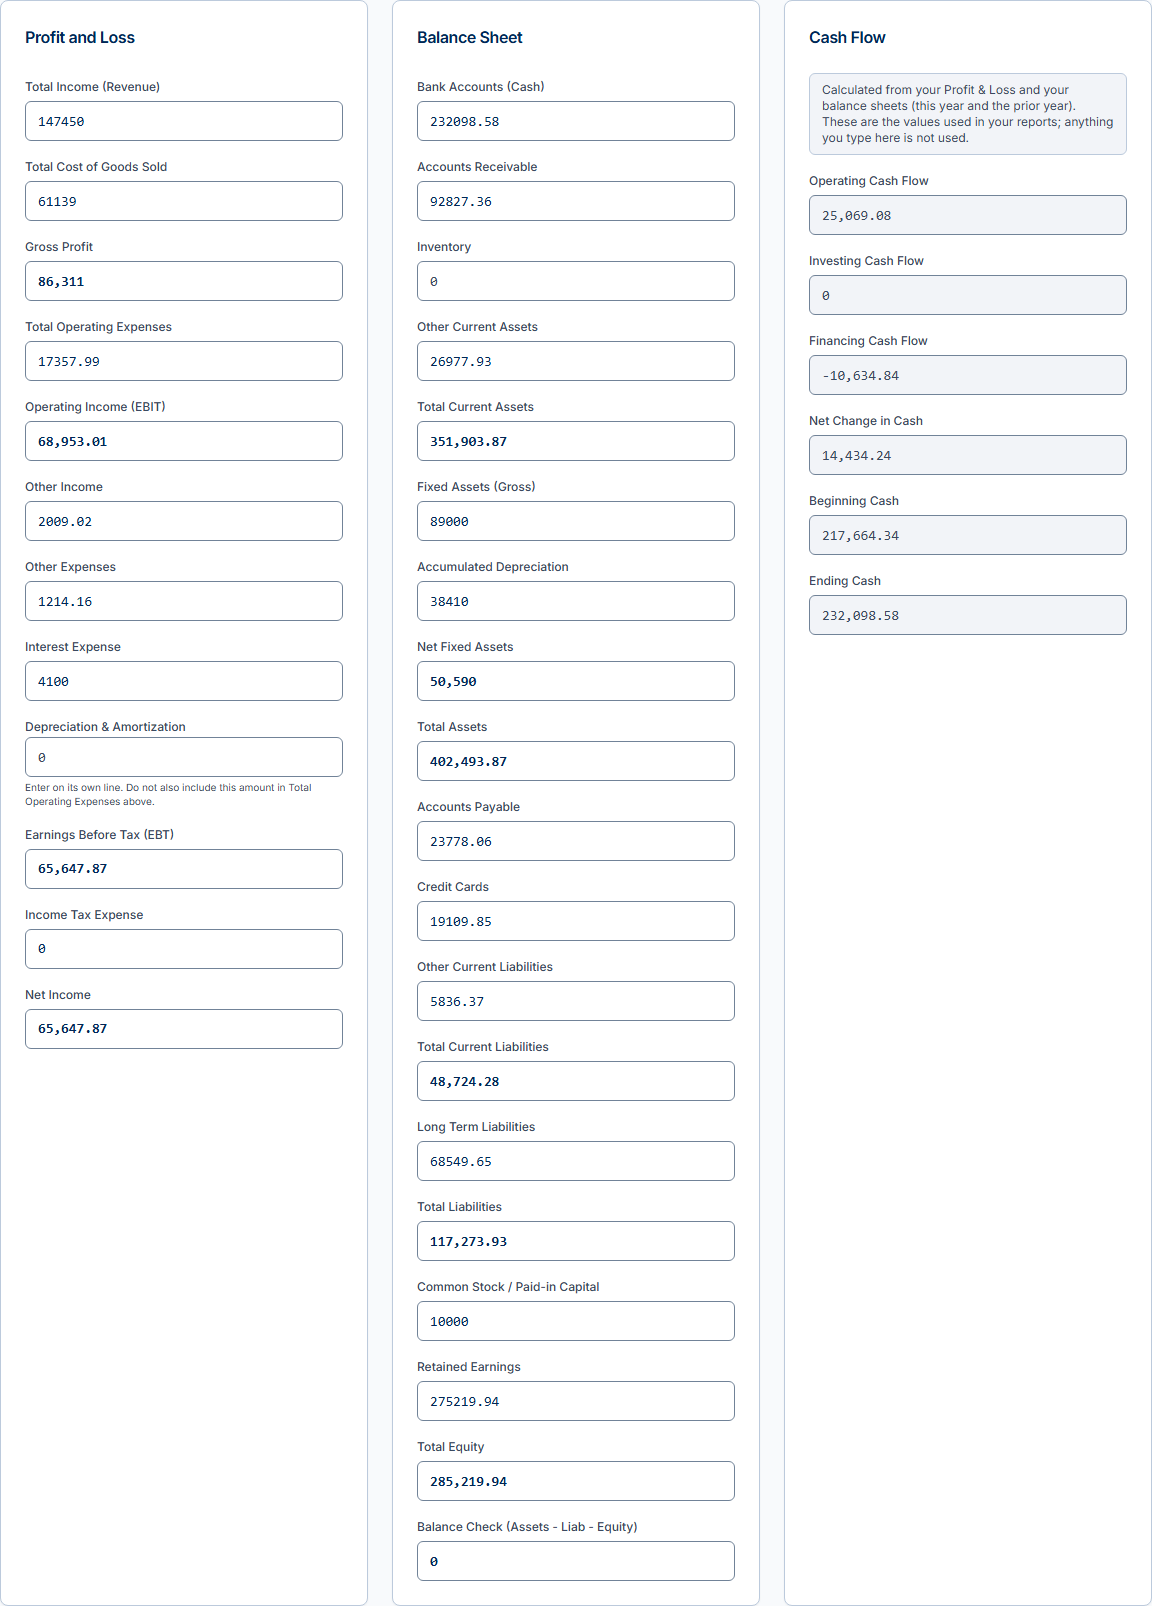
How Entry Works
- One year at a time. The Company and years card at the top holds your Company name and one button per year you have added. Select a year to work on it. To add a year, type it in the Add a year box and select Add year.
- Totals or Accounts. Each year has two entry modes. In Totals you type the headline figure for each line. In Accounts you enter individual accounts (use a colon for a subaccount, for example Truck:Depreciation) and the headline totals are calculated from them. Cash flow stays in Totals mode.
- Live totals, shown in bold. Calculated lines such as Gross Profit, Net Income, and Total Assets show their live total in bold inside the box and update as you type. If you have your own figure for a calculated line, type it over the bold total and 2diff Business uses yours.
- Saved automatically. There is no save button. A badge beside the Company and years heading reads Saving... and then Saved as your figures reach your account.
- Checks that warn, never block. If your balance sheet does not balance, or retained earnings do not roll forward from the prior year, a note under the figures says by how much. Neither check changes your numbers or stops a save.
Your Businesses
Use the business picker at the top of the sidebar. Select Add a business to add one, up to six. Rename this business changes its name. Remove this business deletes one; your first business cannot be removed. With two or more, All businesses (combined) adds them together, read only.
Goals, valuation inputs and forecast defaults are shared by all your businesses. The combined view adds the figures as entered; sales between your own businesses are not removed.
Profit and Loss
Enter these lines for each year. The calculated lines show their live total in bold.
| Line | You enter or calculated |
|---|---|
| Total Income (Revenue) | You enter |
| Total Cost of Goods Sold | You enter |
| Gross Profit | Calculated |
| Total Operating Expenses | You enter |
| Operating Income (EBIT) | Calculated |
| Other Income | You enter |
| Other Expenses | You enter |
| Interest Expense | You enter |
| Depreciation & Amortization | You enter (on its own line, not inside operating expenses) |
| Earnings Before Tax (EBT) | Calculated |
| Income Tax Expense | You enter |
| Net Income | Calculated |
Balance Sheet
The balance sheet is grouped into Assets, Liabilities, and Equity.
Assets
| Line | You enter or calculated |
|---|---|
| Bank Accounts (Cash) | You enter |
| Accounts Receivable | You enter |
| Inventory | You enter |
| Other Current Assets | You enter |
| Total Current Assets | Calculated |
| Fixed Assets (Gross) | You enter |
| Accumulated Depreciation | You enter |
| Net Fixed Assets | Calculated |
| Total Assets | Calculated |
Liabilities
| Line | You enter or calculated |
|---|---|
| Accounts Payable | You enter |
| Credit Cards | You enter |
| Other Current Liabilities | You enter |
| Total Current Liabilities | Calculated |
| Long Term Liabilities | You enter |
| Total Liabilities | Calculated |
Equity
| Line | You enter or calculated |
|---|---|
| Common Stock / Paid-in Capital | You enter |
| Retained Earnings | You enter |
| Total Equity | Calculated |
| Balance Check (Assets - Liab - Equity) | Calculated |
Cash Flow
Once you have entered the year before, you do not enter cash flow figures. 2diff Business builds the full cash flow statement for you using the indirect method, from your net income and the change in your balance sheet since the prior year. The cash flow boxes then show the calculated values and are read-only, with a note that anything typed there is not used.
Cash flow measures change over time, so your earliest year has no prior balance sheet to compare against. For that year only, the cash flow boxes stay open: type your own Operating, Investing, and Financing figures if you have them, or leave them empty. Add an earlier year and 2diff Business calculates that year's cash flow for you instead.
The Balance Check
The Balance Check confirms the accounting equation: total assets should equal total liabilities plus total equity. The Balance Check line in the balance sheet reads zero when your figures are consistent. When they are not, a note under the figures shows assets, liabilities plus equity, and how far apart they are.
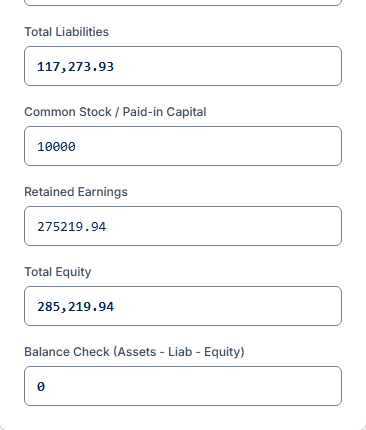
If it does not read zero, one of your entered figures is off. Common causes:
- A missing or mistyped asset, liability, or equity line.
- Retained Earnings that does not reflect prior accumulated profit.
- A fixed asset entered net instead of as gross cost plus accumulated depreciation.
Adjust the entered lines until the Balance Check reads zero. The check is a warning only: it never blocks a save or changes a figure for you.
Adding More Years
A single year gives you statements and ratios. To see trends and a forecast, add more years:
- Type the year you want in the Add a year box.
- Select Add year. A button for the new year appears next to the others and becomes the year you are working on.
- Enter that year's figures.
Two or more years unlock year over year growth, the Trends view, and the Forecast. More years give a clearer trend and a more grounded forecast. To take a year out, select it and use the Remove button next to the Totals and Accounts switch.
Entering Part of a Year
Every year you add is read as a full year unless you say otherwise. If you only have figures for part of the current year, open that year and fill in Figures through under Period covered with the last date your figures cover. Your dashboard, ratios, and forecast then say the year is partial. Year over year growth is left out for that year, because the figures you enter are annual and there is no prior same-period figure to compare a part year against, rather than comparing a few months to a full prior year. Leave the field empty for a full year.
Saving
There is nothing to press. 2diff Business saves each figure to your account as you enter it, and the badge beside Company and years reads Saved once it is stored. Your figures are there the next time you sign in, and you can come back and edit any year at any time. Every analysis screen in the sidebar reads from the same figures, so there is no separate analyze step.
Reading Your Analysis
Pick any screen in the sidebar and 2diff Business builds it from your figures, with the same analysis it runs on connected books. Because your figures are annual, everything below is shown one year at a time or year over year.
Dashboard
The Dashboard is your at-a-glance view: four key numbers (Revenue, Operating expenses, Net Income, and Cash) and a set of trend charts drawn from the years you entered. Use it as the starting point before you dig into individual statements.
Financial Statements
The Statements views present your profit and loss, balance sheet, and cash flow exactly as 2diff Business calculated them from your entries. Use Detail in Data Controls to switch between Summary, Detailed, and Compact, and Years to choose how many years appear side by side. The Combined view shows all three statements together.
Common-Size Analysis
Common-Size Analysis restates your profit and loss as a percentage of revenue and your balance sheet as a percentage of total assets. This makes it easy to compare years even as the business grows, and to see where each dollar goes.
Ratio Analysis
2diff Business calculates 23 financial ratios in four groups (Profitability, Asset Utilization, Liquidity, and Dupont), along with plain-language notes on what each one means for your business. Below the standard set, the Custom ratios card lets you build your own ratio from any two standard statement figures or your own saved figures, and save it, so a metric specific to your business is calculated for every year in view. See the Ratios section of the 2diff Business Guide for a walk-through of each ratio.
Trend Analysis
With two or more years entered, the Trends view charts how revenue, expenses, profit, and key balance-sheet lines move over time. Trends from typed figures are annual (one point per year). For month-by-month or quarter-by-quarter trends, connect your books on Silver.
Forecast
The Forecast tab projects your figures forward. Choose a method:
- Level holds the most recent year flat.
- Growth applies a growth rate you set.
- Goals holds each metric at the target you set in Goal Center for every forecast year. If no goal has a target, it falls back to Level.
- Drivers builds the forecast from your own assumptions and shows any Needed Financing.
Your forecast starts from your annual figures. The Frequency switch can show it by quarter or by month. Income and cash-flow lines are split evenly across the year, not seasonally, and balance-sheet lines are carried, not divided. To add projected columns to Statements and Ratios, set Forecast columns to On in the sidebar. See the Forecast section of the 2diff Business Guide for full detail on the settings.
Goal Center
Goal Center is included with 2diff Business. Set targets for the metrics that matter to you and track your actual figures against them. You can set goals across profit and loss, balance sheet, cash flow, and ratio metrics, and use the Goals method in the Forecast to project toward them. You can export your goals and their tracked progress to CSV or an Excel workbook, and review archived goals in the History panel.
See the Goal Center section of the 2diff Business Guide for how goals and progress are calculated.
AI Insights (Silver and Gold)
AI Insights is part of the Silver and Gold plans. Bronze has no AI, and the Bronze demo shows none. On Silver with typed figures, AI Insights reads the figures you entered, so you can ask things like “how is my profitability trending” and get an answer about your numbers. Responses are analysis and observations, not recommendations. Verify anything important against your own records.
The AI Insights section of the 2diff Business Guide covers the controls, the model options, and how to get the most from your questions.
What 2diff Business Silver Adds
2diff Business Bronze and Silver run the same analysis on the figures you type. Consider 2diff Business Silver if you want:
- AI Insights. Ask plain-language questions about your figures and get analysis, not advice.
- Automatic data from your accounting software. Connect once and your figures load and refresh on their own. Nothing to type in.
- Monthly and quarterly detail. Connected books carry period-by-period data, so trends and forecasts can be monthly or quarterly, not just annual.
You can move from 2diff Business Bronze to Silver at any time: select Upgrade on the 2diff Business Silver card in your App Dashboard to change plans. Prices for every plan are on the Plans and Pricing page.
Settings
Open Settings to manage your account:
- Account information: your email and account details.
- AI preferences (Silver and Gold): choose your default AI model. Bronze has no AI, so this card does not appear.
- Forecast defaults: set the default forecast method and growth rate.
- Valuation defaults: set the starting assumptions for each valuation method.
When you type your own annual figures, there is no accounting connection to manage here. Your figures are managed on the Enter Data screen, including Delete my entered data.
Troubleshooting
The Balance Check is not zero
Your entered assets do not equal liabilities plus equity. Re-check each entered line. The usual culprits are a missing balance-sheet line, a Retained Earnings figure that does not match accumulated prior profit, or a fixed asset entered net instead of as gross cost plus accumulated depreciation. See The Balance Check above.
Cash flow is empty for my first year
Cash flow is calculated from the change between two years, so your earliest year has nothing to compare against. Either type that year's cash flow figures yourself or add an earlier year and 2diff Business calculates them.
Trends, growth, or Forecast look empty
All three need at least two years of figures. Add another year. If the newest year is a part year, its year over year growth is left out, because typed figures are annual and there is no prior same-period figure to compare a part year against (see Entering Part of a Year).
A figure looks wrong in the analysis
Open Enter Data, select the year, check the figure you entered for that line, and correct it. It saves as you type, and every screen recalculates from your entries.
Getting Help
Reach us at info@2diff.io with any question about your account or the analysis.
- 2diff Business Guide covers every screen and the shared features in full detail.
- Quick Start: Enter Your Own Figures is a short walk through the demo and your first year of figures.
- 2diff Business Quick Start covers both ways to start.
- Your own figures overview explains who typing your figures in is for.
Disclaimers
Your Figures
2diff Business builds your statements and analysis from the figures you enter. The accuracy of the results depends on the accuracy of what you type. 2diff Business calculates totals and derived statements from your inputs; it does not verify them against source records.
Financial Analysis
2diff Business provides financial analysis tools for educational purposes only. The information presented is not professional financial, tax, or legal advice, should not be the sole basis for business decisions, and does not replace consultation with qualified professionals. Always consult with your accountant, bookkeeper, or financial advisor for important business decisions.
AI-Generated Content
On Silver and Gold, AI Insights use artificial intelligence to analyze your figures. They may occasionally produce inaccurate or incomplete information and should be verified against your source data for critical decisions.
Second Difference Solutions®, LLC
Clarksburg, WV | 2diff.io