BizAnalyzer Quick Start Guide
From Sign-Up to First Insights in 5 Minutes
Last verified against the app:
Welcome to BizAnalyzer
BizAnalyzer transforms your accounting data into powerful financial insights. No spreadsheet expertise required. Connect your books and let us do the heavy lifting.
This Quick Start Guide covers the essentials to get you up and running. For detailed instructions on every feature, see the Complete Guide.
Getting Started
Step 1: Sign In
- Go to the App Dashboard
- Sign in with Google or create an email/password account
- Verify your email if prompted
Step 2: Subscribe
- Click BizAnalyzer from the Apps page
- Subscribe to BizAnalyzer, $29.99/month: connected accounting data, financial statements, ratios, AI insights with flagship models, forecasting, Goal Center, and persistent caching
- Complete payment through Stripe
Not on accounting software? Subscribe to BizInsights instead, $19.99/month: type your annual figures and get the same statements, ratios, trends, forecast, and AI insights. Try the live BizInsights demo first if you want to see it in action, then follow the BizInsights Quick Start. A BizAnalyzer subscription includes BizInsights, so you can use both.
Step 3: Connect Your Accounting Data
- Launch BizAnalyzer from your App Dashboard
- Click the Connect to QuickBooks® button in the sidebar's Accounting Data panel
- Sign in to your accounting software and authorize the connection
- Your data loads automatically
That's it. You're ready to explore your financial data.
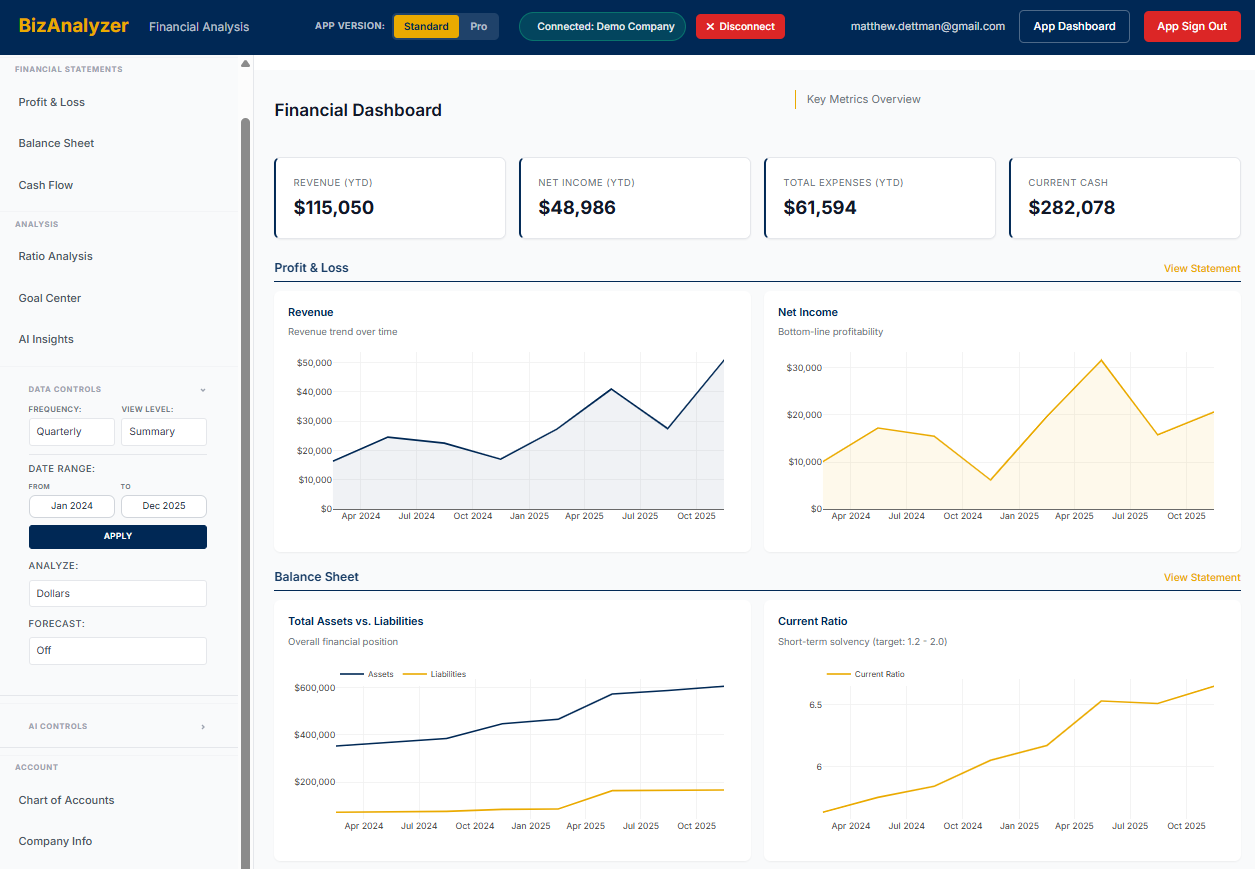
Navigating the App
BizAnalyzer uses a sidebar with grouped navigation. Here is what each section contains:
| Group | Tab | What It Shows |
|---|---|---|
| Accounting Data | Dashboard | Key metrics at a glance: Revenue, Operating expenses, Net Income, Cash |
| Financial Statements | Profit & Loss | Revenue, expenses, and net income |
| Balance Sheet | Assets, liabilities, and equity | |
| Cash Flow | How cash moves in and out of your business | |
| Combined | All three statements side by side | |
| Analysis | Trends | Period-over-period changes |
| Ratios | 23 ratios: profitability, asset utilization, liquidity, and Dupont | |
| Forecast | Projected future periods | |
| Goal Center | Set and track financial targets | |
| Valuation | Six business-valuation methods | |
| AI Insights | AI Insights | AI-powered analysis and Q&A |
| Account | Chart of Accounts | Your account listing |
| Company Info | Business profile and connection details | |
| Settings | Account, preferences, and data management | |
| Resources | Links to support, terms, privacy, and security |
Data Controls
Below the navigation, the Data Controls panel lets you configure how data is grouped and displayed. Click the header to expand or collapse it. Changes apply the moment you click, so there is no separate apply step.
| Control | Options | What It Does |
|---|---|---|
| Period | Annual, Quarterly, Monthly | Sets the column grouping for financial statements |
| Detail | Summary, Detailed, Compact | Switches between category totals and line-item views |
| Years | 3, 5, 10 | Sets how many recent years the statements and charts cover |
Setting the Time Window
Use the three Data Controls segments to frame every section at once:
- Set Period to Annual, Quarterly, or Monthly (Annual only on manual entry data)
- Set Years to 3, 5, or 10 to choose how far back to look
- Set Detail to Summary, Detailed, or Compact
Every section updates immediately as you change these.
Quick tips:
- For year-over-year analysis, use Annual with 3 or 5 years
- For a closer look, switch Period to Quarterly or Monthly
- For trend patterns, keep at least a few years in view
Key Features at a Glance
Dashboard
Your financial snapshot with four year-to-date numbers at the top:
- Revenue: Total income booked this year
- Operating expenses: Operating overhead (not cost of goods sold, interest, or tax)
- Net Income: Your bottom-line profit
- Cash: Bank balance as of the latest report
Below the numbers, four line charts under Trends at a glance tell the story of the business, one point per full year. A year still in progress is left out, because a few months next to full years would look like a decline; a note on the first chart says so, and its revenue, expenses, net income and cash so far are in the numbers above.
- Profit & Loss overview: Revenue, Operating expenses, and Net Income. If revenue rises while net income stays flat, you are selling more but keeping less of every dollar.
- Balance sheet health: Total Assets and Total Liabilities. The gap between the two lines is your net worth in the business.
- Cash: Operating Cash Flow and Cash Position. Separates whether the business generated cash that year from what is actually in the bank.
- Growth Rates: Revenue and Net Income growth, each year against the year before. This is the momentum chart.
See the Complete Guide for a deeper walk-through of each chart.
Financial Statements
Each statement has its own sidebar tab for direct access:
- Profit & Loss: Revenue, expenses, and net income
- Balance Sheet: Assets, liabilities, and equity
- Cash Flow: How cash moves in and out
On any statement, use the Mode control at the top of the table to switch views:
- $: Standard dollar amounts
- $ Δ: Period-over-period dollar changes
- % Δ: Period-over-period percentage changes
- Common Size: Line items as percentages of revenue or total assets
Forecast
In the sidebar's Analysis group, set Forecast columns to On to append projected columns to the statements and ratios. The Forecast tab has the full projection view: pick a Method (Level, Growth, or Goals), then set the growth rate and horizon. The Goals method projects from the targets you set in Goal Center.
AI Insights
The first time you open AI Insights, a short Before you start note explains that the AI can be wrong; tick the box and select Continue to AI Insights. The Response Length control, inside AI Model in the sidebar, sets how long answers are (Quick, Medium, or Thorough). Then ask questions about your business in plain English:
- "What are my biggest expense categories?"
- "How is my profit margin trending?"
- "What should I be concerned about?"
Quick Actions
Jump straight to any section from the sidebar: Profit & Loss, Balance Sheet, Ratios, Forecast, and the rest are all one click away.
Inside AI Insights, expand Suggested questions for one-click prompts that run common analyses for you:
- Performance Summary: Overview of your financial position
- Key Ratios: The ratios that matter most
- Cash Flow: Cash trends and observations
- Red Flags: Potential areas of concern
Tips for Success
Start with the Dashboard
The Dashboard gives you a quick health check. If numbers look off, investigate in the detailed tabs.
Use the Statement Modes
Switch a statement's Mode control to $ Δ or % Δ to see period-over-period trends directly in your financial statements. Look for patterns over several periods.
Try AI Insights
Don't know what to look for? Ask the AI. It analyzes your data and highlights what matters.
Compare with Common Size
Set a statement's Mode control to Common Size to view line items as percentages. This reveals proportional changes that raw dollar amounts can hide.
Need More Detail?
This Quick Start covers the essentials. For comprehensive instructions on every feature, view the Complete Guide.
Getting Help
Email: info@2diff.io
We typically respond within 1-2 business days.
Additional Resources:
- Complete Guide: Detailed feature instructions
- BizAnalyzer FAQ: Common questions
- Getting started with accounting: Set up accounting software before you connect
- Support Page: Contact and FAQ
- Security Info: How we protect your data
Ready to explore? Sign in, connect your accounting data, and discover what BizAnalyzer reveals about your business.
Next Steps
Ready for detailed instructions? Explore the Complete Guide for comprehensive documentation on every feature.
This content is for educational purposes only and does not constitute financial, tax, accounting, or legal advice. Consult with a qualified professional for advice specific to your situation. AI-generated insights may contain errors; verify information before taking action. Intuit and QuickBooks® are registered trademarks of Intuit Inc. Used with permission. Second Difference Solutions®, LLC is an independent software provider and is not affiliated with, endorsed by, or sponsored by Intuit Inc. Our applications integrate with QuickBooks® products via Intuit's official APIs.